Multiscale Carbon Burden of Infrastructure in the United States
WCTR, Toulouse, France
2026-10-01
Overview
- Study land use & climate mitigation relationship by combining Vulcan 1-km gridded fossil fuel CO2 (FFCO2) & EPA Smart Location Database land use features
- Partition emissions into transportation, residential energy, & scope 2 residential electricity
Motivation
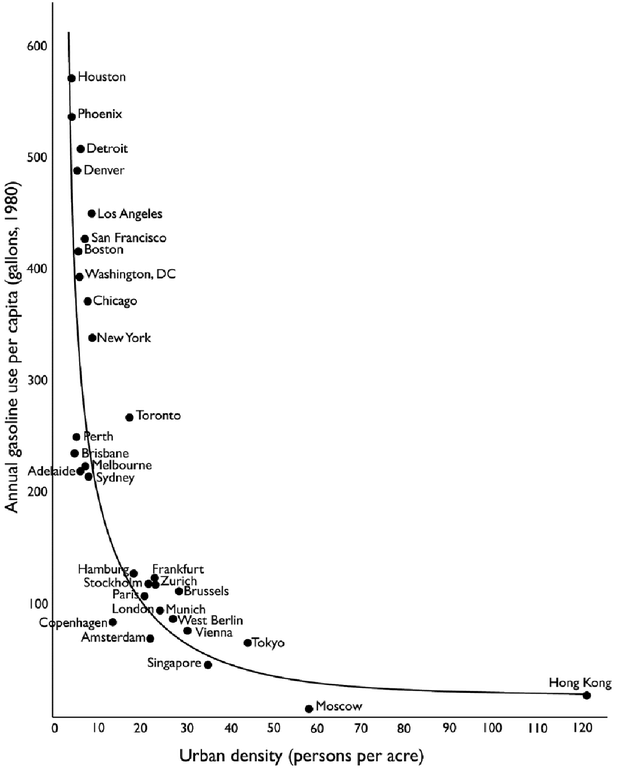
![]()
Newman & Kenworthy (1989)
Literature
- Urban economics: Glaeser & Kahn (2008) used an ad-hoc CO2 estimation strategy to compare 66 metropolitan areas
- Lowest CO2 rates in California
- Highest CO2 rates in Texas & Oklahoma
- Development restrictions push new development into high CO2 regions
- Urban planning: Kockelman (1997) + Cervero & Ewing (2010) examine 3/5Ds of land use
- Density, Diversity, Design, Destination Access, & Distance to Transit
- Urban science: Fragkias et al. (2013) used earlier version of Vulcan CO2 dataset (1999-2008) to study urban scaling in total CO2
- Found proportional scaling of 0.95% increased CO2 per 1% increase in population – i.e., larger cities not significantly more efficient
Two Column Layout
Left column
- Point one
- Point two
- Point three
Right column
![]()
Comparison
| Build in-house |
High |
6 months |
Medium |
| Partner build |
Medium |
3 months |
Low |
| Off-the-shelf |
Low |
2 weeks |
High |
In their words
This is where a pull-quote goes — styled with a left accent rule instead of a decorative bar, matching the “avoid accent stripes” guidance while still standing apart from body text.
What’s next
Approvals → Kickoff → Delivery
Thank you
Questions? Reach out any time.
jfhawkin@ucalgary.ca
Presentation & paper available:
![]()
https://hawkins-tech-lab.github.io/